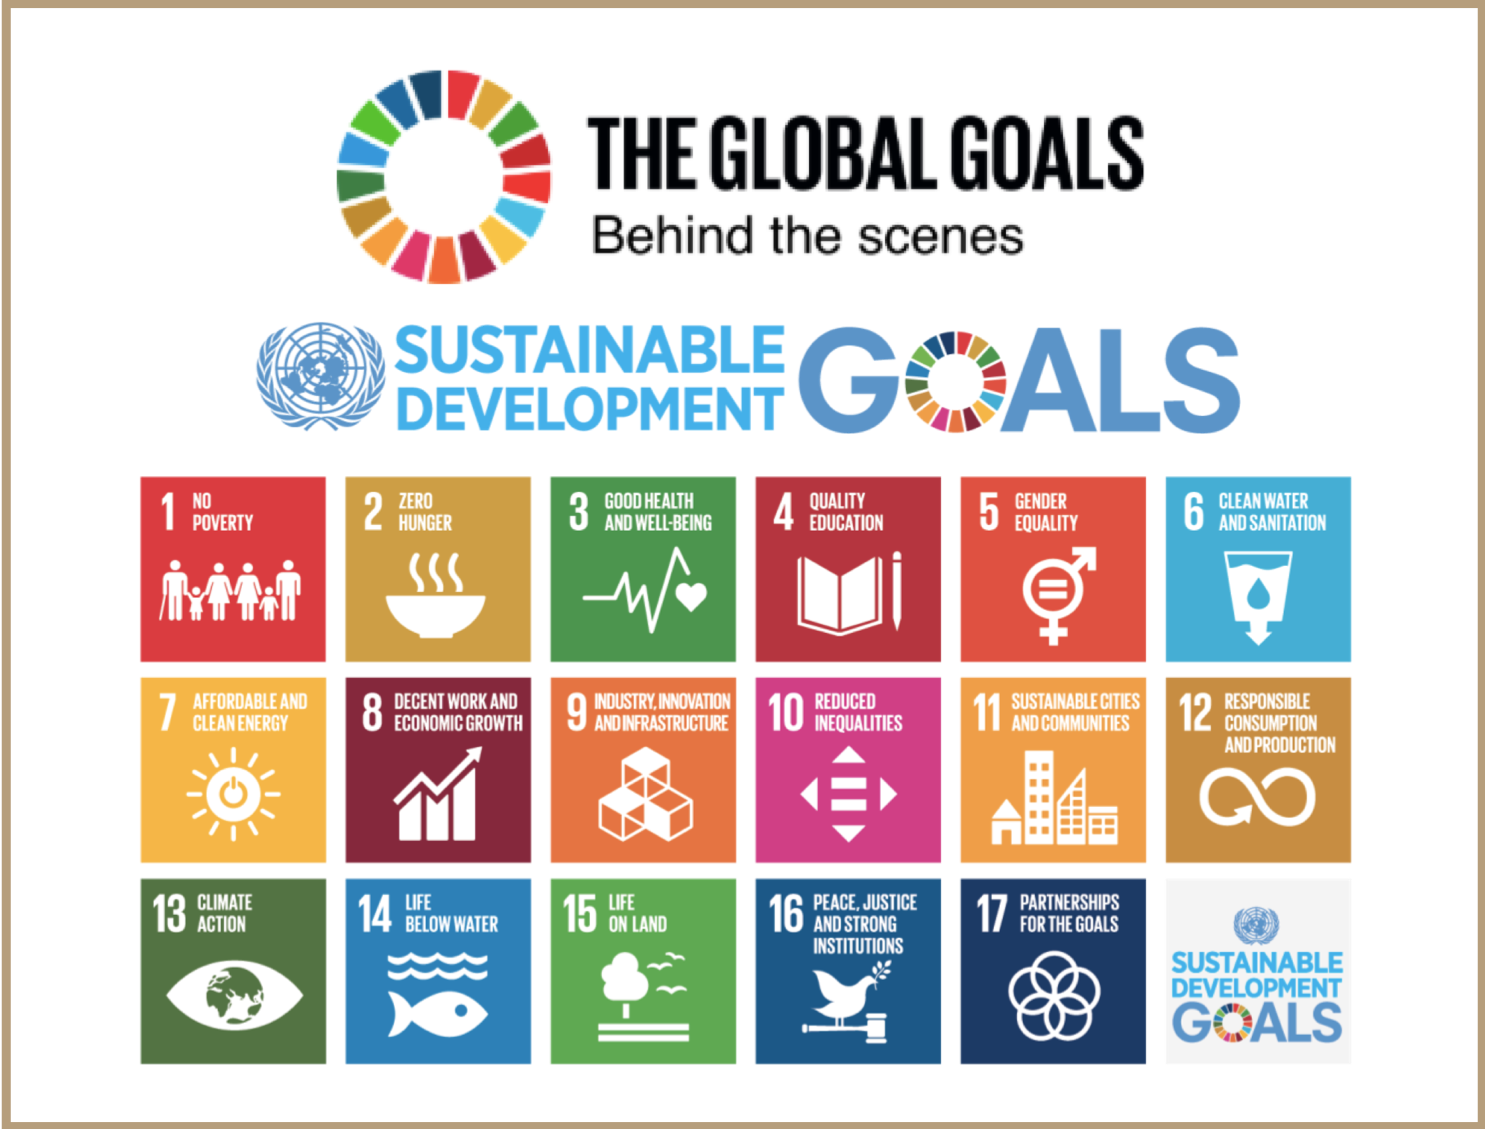
This assignment was part of Information Visualization course at KTH where a team of 8 students had to work on a project proposed by the Stockholm Environmental Institute (SEI) on visualizing data collected by the SEI and make it possible for analyzing the interactions between different Sustainable Development Goals. The visualization of the data set we created was intended to help researchers identify important connections and interactions between these goals.
ABOUT Link